latest data
data graphs
raw data
| date | time | DHT tmp (°C) | BME tmp (°C) | SCD tmp (°C) | DHT hum (%) | BME hum (%) | SCD hum (%) | PM1 (µg/m³) | PM2.5 (µg/m³) | PM10 (µg/m³) | 0.3 µm (#/L) | 0.5 µm (#/L) | 1.0 µm (#/L) | 2.5 µm (#/L) | 5.0 µm (#/L) | 10 µm (#/L) | CO₂ (ppm) | gas (kΩ) | pressure (hPa) |
|---|
info
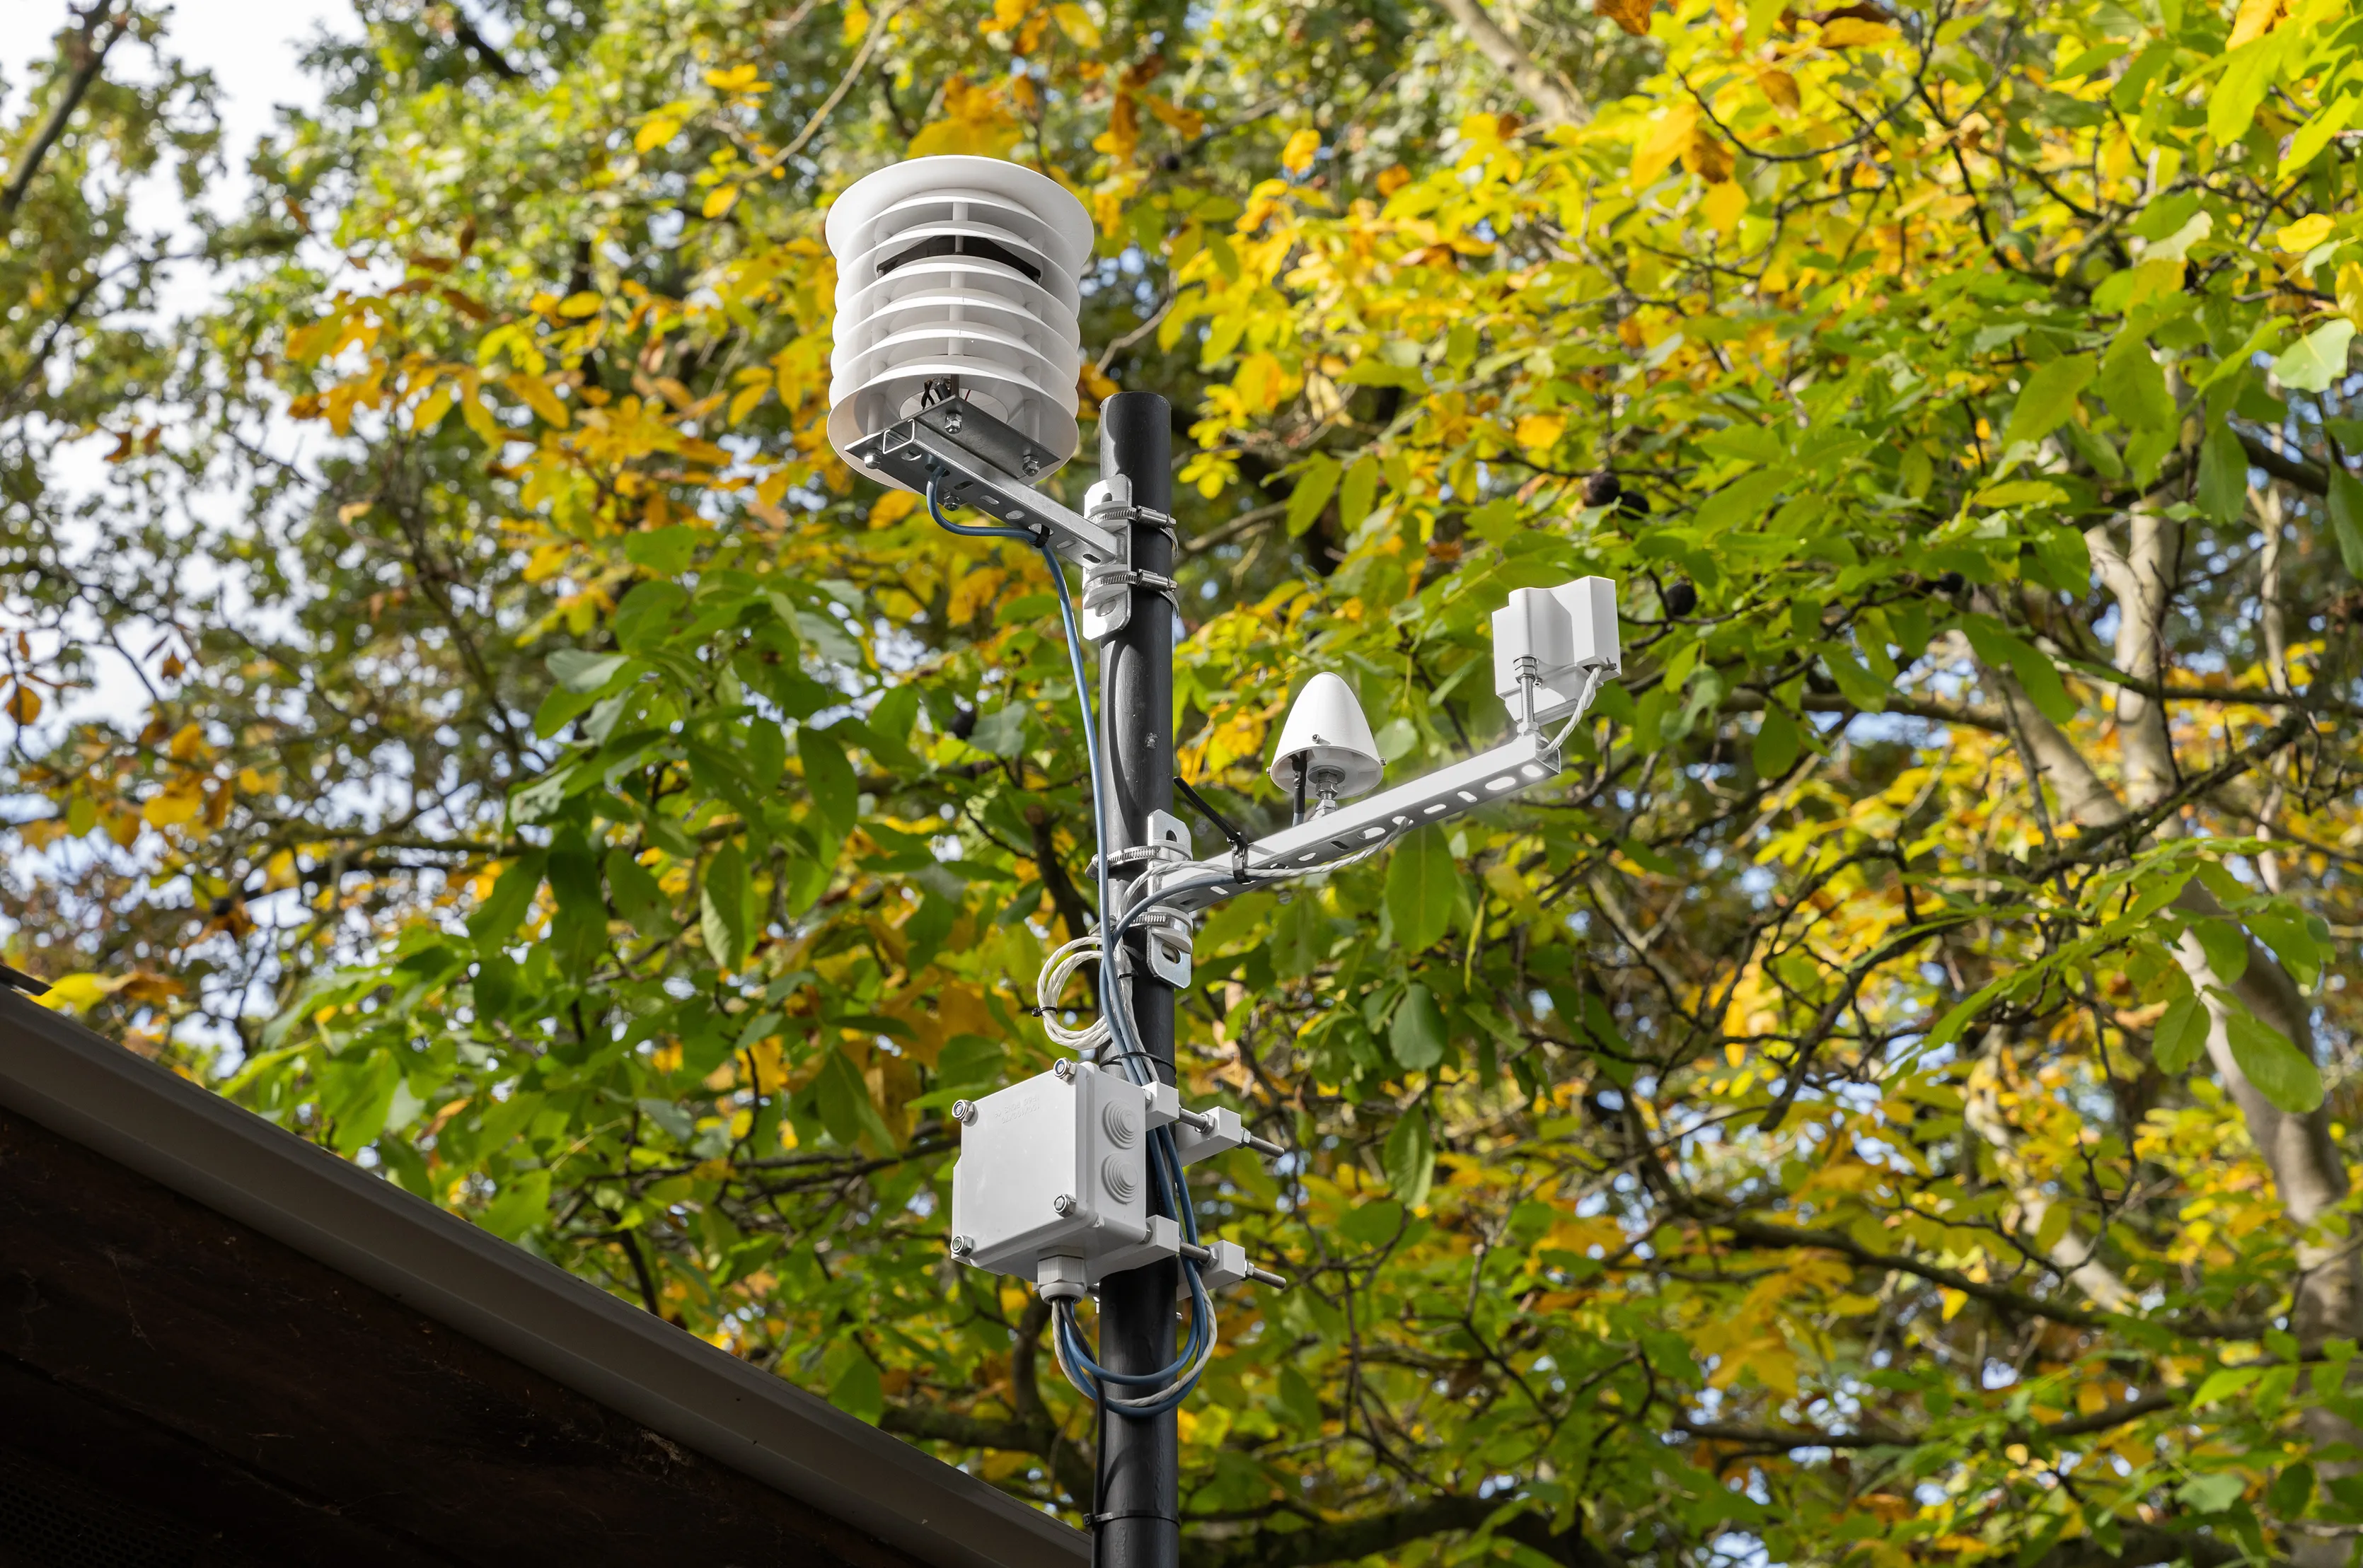
Located in the Umweltgarten, this weather station is part of a collaboration with the garden exploring urban ecologies, environmental monitoring, and the relationship between technology and the living world. It continuously records local environmental conditions, making changes in its immediate surroundings measurable and visible.
The system combines several sensors to measure air temperature and humidity (DHT22, BME680, SCD41), atmospheric pressure, and gas resistance as an indicator of changes in air composition. A particulate matter sensor (PMS 5003) measures airborne particles of different sizes, including PM1, PM2.5, and PM10. Carbon dioxide levels are also recorded (SCD 41). The collected data is transmitted automatically and made accessible through this website.
Beyond its function as a monitoring device, the installation is part of an artistic research practice concerned with how we observe and interpret our environment. It connects to my PhD project Vegetal Diaries, which investigates urban plants, energy flows, and practices of environmental observation. The research explores how plants and their living conditions can be approached through different forms of sensing, and how measurement technologies shape what we perceive as our environment — including what remains invisible or unmeasured.